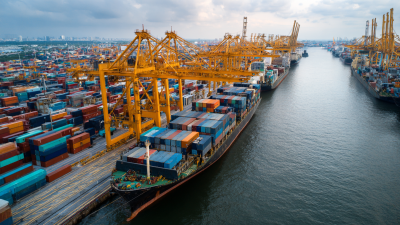
How to Reduce Sea Shipping Costs in 2026?
In 2026, sea shipping costs will depend on more than the ocean freight quote. Fuel prices, port congestion, container availability, emissions rules, and regional surcharges can quickly change a budget. A shipment that looks affordable in Shanghai may become expensive after inland transport, documentation, storage, and destination handling. This guide examines practical ways to control costs without weakening compliance or delivery reliability.
Good planning starts with accurate shipment data. Measure product volume, gross weight, carton dimensions, seasonal demand, and required delivery dates. Small packaging changes can reduce unused container space. For example, reducing each carton by two centimeters may create room for several additional cartons. Compare full-container and less-than-container options using the complete landed cost, not only the freight rate. Request itemized quotations from qualified forwarders, and confirm every surcharge. Check transit time, free storage days, inspection procedures, insurance, and carrier reliability.
Technology can also improve shipping decisions. Rate dashboards, tracking tools, and performance records reveal expensive patterns. A supplier may offer a low price but repeatedly miss cut-off times. That is not a saving. Consolidating compatible orders, booking earlier, and choosing flexible sailing dates may reduce premium charges. However, aggressive cost cutting can create stockouts or damage customer trust. The balance is difficult. Review every shipment after delivery, record actual costs, and adjust the next plan. Some assumptions will be wrong. That feedback matters.
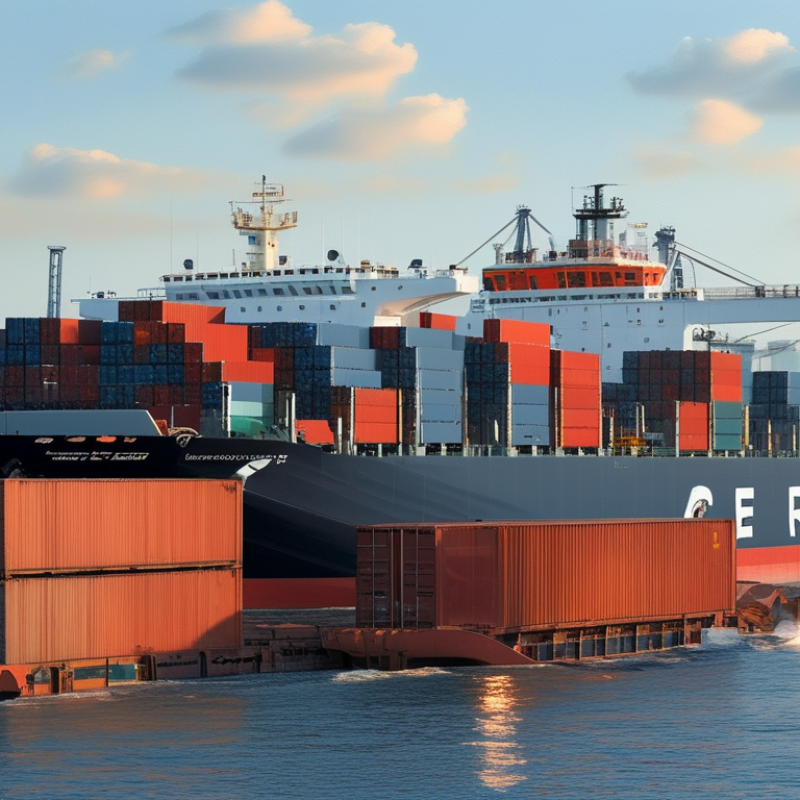
Measure the Cost Base Using UNCTAD’s 80%+ Sea-Trade Volume Benchmark
How to Reduce Sea Shipping Costs in 2026?
UNCTAD reports that more than 80% of global trade by volume moves by sea. This benchmark shows why ocean freight remains central to international supply chains. It also provides a realistic basis for measuring shipping costs. Instead of judging one invoice, calculate the full cost per container, tonne, or shipped unit. Keep the measurement consistent.
Build a cost base from freight, fuel adjustments, terminal handling, documentation, customs support, inland transport, storage, and insurance. Separate fixed charges from volume-based charges. For each route, record the port pair, container type, sailing frequency, transit time, and average dwell time.
A low freight rate may become expensive when containers wait several days at a congested port. Check accessorial fees carefully. Small errors multiply quickly.
Our first cost model looked accurate but ignored empty-container repositioning. That weakness changed the result. Review invoices against booking records each month, then compare planned and actual costs. Ask whether slower transit creates extra inventory expense. Sometimes, it does.
A practical review should also test alternative sailing windows, shipment consolidation, and more reliable inland scheduling. Do not optimize freight alone. Measure the complete movement from supplier door to receiving dock, using the 80%+ sea-trade benchmark as the commercial context.
Compare Routes and Contracts with Xeneta’s Spot-Rate Market Data
Reducing sea shipping costs in 2026 starts with comparing live spot rates, not accepting one annual quote. Track each origin-destination pair weekly. Include port fees, fuel adjustments, handling, and inland delivery. A low ocean rate can hide expensive delays.
UNCTAD’s Review of Maritime Transport 2024 reported that rerouting around Africa increased global shipping distances and raised ton-miles by almost 6%. This makes route selection financially important. Compare direct services with alternatives through nearby hubs. Check sailing frequency, transit-time variation, and port congestion. Data exposes the gap. A route saving 120 dollars per container may lose value after seven extra days of inventory.
Contract comparison requires the same discipline. Place annual contract rates beside recent spot-rate medians for identical equipment, ports, and surcharge conditions. The World Bank’s Logistics Performance Index 2023 showed major differences in customs efficiency, infrastructure, and shipment timeliness across economies. Those differences affect the real cost of each route. Use a flexible allocation, such as fixed volume for stable demand and spot exposure for weaker forecasts. Small leaks matter. My first comparison focused too heavily on ocean price. That was incomplete. Detention risk, rolled bookings, and missed production windows also deserve a monetary value. Recheck the model monthly, because a contract that looks safe in January may become costly by September.
Reduce Fuel Use Through Slow Steaming Under the IMO 2023 Strategy
How to Reduce Sea Shipping Costs in 2026?
Reduce Fuel Use Through Slow Steaming Under the IMO 2023 Strategy
Slow steaming can lower sea shipping costs by reducing fuel consumption per voyage. Its value becomes clearer as fuel prices and carbon-related requirements remain uncertain. The IMO 2023 Strategy encourages lower greenhouse-gas emissions and stronger carbon-intensity performance across international shipping. Lower speed supports these goals when vessels operate within safe and practical limits.
A vessel moving at 18 knots may use significantly more fuel than one sailing at 15 knots. The exact saving depends on hull design, cargo weight, weather, and engine condition. Operators should compare fuel data from similar routes, not rely on general estimates. A voyage dashboard can track speed, engine load, fuel use, arrival time, and emissions. This makes cost decisions more reliable.
Time still matters. Slower voyages can delay inventory, increase reefer electricity use, or create missed port connections. That is the difficult part. A better plan may use slow steaming on open-water legs, then adjust speed near congested ports. Weather routing also helps avoid wasting fuel against strong currents. However, perfect savings are unlikely. Poor scheduling can erase them. Regular reviews are necessary, especially when cargo deadlines change. Teams should test different speeds, document the results, and accept that the cheapest sailing is not always the fastest one.
Improve Container Utilization Against the Industry’s 85% Target
How to Reduce Sea Shipping Costs in 2026?
Improve Container Utilization Against the Industry’s 85% Target
Container utilization is often measured against an industry target of about 85%. This figure is useful, but it should not become a blind rule. A container filled to 95% can still waste money if cartons are poorly arranged or difficult to unload.
Start with accurate shipment data. Record carton dimensions, weights, pallet patterns, and product restrictions before booking space. A loading plan can reveal unused corners and excessive air inside packages. For example, reducing carton height by two centimeters may allow an extra layer on several pallets. Small changes can create meaningful savings across repeated shipments.
Use load simulations for mixed cargo. Check both cubic volume and weight limits. Heavy goods should stay low, while fragile cartons need stable support. Do not push every container to its physical limit. Damaged cartons, slow unloading, and rejected pallets can erase the savings. We learned this the hard way.
Packaging reviews should involve warehouse staff, not only procurement teams. They understand where cartons collapse, shift, or become difficult to handle. However, packaging changes need testing. A smaller box may improve utilization but increase product damage. Trial one route first, measure results, and adjust the loading plan monthly. The 85% target is a reference point, not a guarantee of efficiency.
How to Reduce Sea Shipping Costs in 2026? - Improve Container Utilization Against the Industry’s 85% Target
| Container Type | Nominal Internal Volume (m³) |
Typical Maximum Payload (kg) |
Current Utilization (72%) |
85% Target Utilization | Additional Usable Volume per Container (m³) |
Primary Cost-Reduction Action |
|---|---|---|---|---|---|---|
| 20-foot dry container | 33.2 | 28,200 | 23.9 m³ | 28.2 m³ | 4.3 | Reduce empty space and standardize carton dimensions |
| 40-foot dry container | 67.7 | 28,750 | 48.7 m³ | 57.5 m³ | 8.8 | Use load-planning software and fill by volume before weight |
| 40-foot high-cube container | 76.4 | 28,600 | 55.0 m³ | 64.9 m³ | 9.9 | Prioritize high-cube equipment for light, bulky cargo |
| Mixed-SKU shipment | — | — | 72% average | 85% target | 13 percentage points | Combine compatible SKUs and use cube-based loading rules |
| Palletized cargo | — | — | Lower than loose-loaded cargo when pallets are oversized | 85% or higher | Depends on pallet footprint | Use standardized pallet footprints and stackable packaging |
| Weight-constrained cargo | — | Container-specific | May exceed weight limit before 85% volume | 85% volume where legally feasible | Not applicable | Balance cubic utilization with verified gross mass limits |
| Illustrative shipment impact | 72% utilization | 85% utilization | 15.3% fewer containers | Lower container-related cost per shipped unit | ||
Budget EU ETS Charges as Maritime Coverage Reaches 100% in 2026
Reducing sea shipping costs in 2026 requires closer attention to EU ETS charges.
Maritime coverage is scheduled to reach 100% of verified emissions for covered voyages. The cost can therefore become a major budget item, not a minor surcharge.
A practical estimate starts with fuel consumption, voyage distance, vessel size, and the applicable EU route. Keep a separate allowance budget for each shipment.
Use verified emissions data from voyage records, fuel reports, and independent checks. A spreadsheet helps. It is not perfect.
Delays, weather, port congestion, and unexpected fuel use can change the final amount.
Speed management often provides a measurable saving.
A small reduction in sailing speed can lower fuel consumption and related emissions. Better cargo consolidation may also reduce emissions per container.
Choose routes with fewer waiting hours when schedules allow.
Shore-side electricity can help at suitable ports, but availability must be confirmed before booking.
Carriers should also review whether a voyage falls within EU ETS requirements, because geographic coverage and reporting duties can vary.
Ask for a clear calculation showing the emissions basis, allowance price, and administrative fee.
That detail matters. Without it, a low freight quote may hide a high environmental surcharge.
Related Posts
-
Top 10 Benefits of Using Sea Freight for International Shipping Solutions
-
2026 Best Sea Freight Options for Efficient Shipping?
-

How to Choose the Right Sea Freight for Global Sourcing?
-
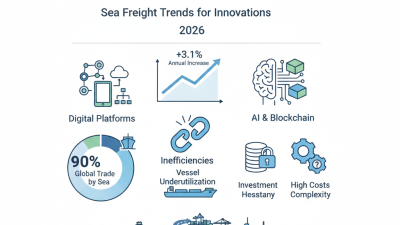
2026 Top Sea Freight Trends and Innovations You Should Know?
-
What is a Sea Container and How to Buy One?
-
Why Mobile Containers Are Revolutionizing Modern Storage Solutions